INTRODUCTION: When people have a fasting blood glucose test and the results come back normal they’re told (or assume) that everything’s fine. But is it? Certainly, a fasting blood glucose test is the least expensive test to find out if someone is already pre-diabetic, but for those wanting to avoid becoming diabetic and to lower their risk of the other chronic disease associated with type 2 diabetes and high levels of circulating insulin (called hyperinsulinemia) noticing abnormalities in how we process carbohydrates is essential and these changes are estimated to take place a decade before our fasting blood sugar begins to become abnormal.
Our bodies have to maintain the glucose (sugar) in our blood at or below 5.5 mmol/L (100 mg/dl) but each time we eat or drink something other than water or clear tea or coffee, our blood sugar rises as our body breaks down the carbohydrate in the food from starch and complex sugars to glucose, a simple sugar. Eating causes hormones in our gut, called incretin hormones to send a signal to our pancreas to release insulin, which moves the excess glucose out of our blood and into our cells. When everything is working properly, our blood sugar falls back down to a normal level within 2 hours after we eat.
If we’re healthy and don’t snack after supper, our blood sugar falls to a lower level overnight but that too is maintained in a tightly regulated range between 3.3 mmol/l (60 mg/dl) and 5.5 mmol/l (100 mg/dl). During the night and as we approach morning, our body will break down our stored fat for energy and convert it to glucose in a process called gluconeogenesis.
When we have a fasting blood glucose test, it measures our blood sugar after we’ve fasted overnight and when we’re healthy, the results will be between 3.3-5.5 mmol/L (60-100 mg/dl). If it is higher than 5.5 mmol/l (100 mg/dl) but less than 6.9 mmol/L (125 mg/dl) we are diagnosed with impaired fasting glucose, but what if it’s normal? Is a normal fasting blood glucose test result enough to say that we’re not at risk for Type 2 Diabetes? No, because a fasting blood glucose doesn’t tell us anything about how our body responds when we eat!
A 2 hour Oral Glucose Tolerance Test (2 hr-OGTT) may be requested for people whose fasting blood glucose is impaired (higher than 5.5 mmol/L) in order to see if it returns to normal after they consume a specific amount of glucose (sugar).
If their blood sugar returns to normal (less than 5.5 mmol/L) 2 hours after drinking a beverage containing 75 g of glucose (100 g if they’re pregnant) then the diagnoses remains impaired fasting glucose because it is only abnormal when fasting. However, if the results are greater than 7.8 mmol/L (140 mg/dl) but below 11.0 mmol/L (200 mg/dl), then they are diagnosed with impaired glucose tolerance which is called “pre-diabetes”.
If the 2 hour results are greater than 11.0 mmol/L (200 mg/dl), then a diagnosis of Type 2 Diabetes is made because their fasting blood glucose is > 7.0 mmol/L (126 mg/dl) and their 2 hour blood glucose is > 11.0 mmol/L (200 mg/dl).
But what if someone’s fasting blood glucose is normal? Does this mean that everything’s fine? Not necessarily, unless we know what happens to their blood sugar after a carbohydrate load, especially after 30 minutes or 60 minutes.
A 2016 study looking at blood sugar response (and insulin response) from almost 4000 men aged 20 years or older and 3800 women aged 45 years or older who had a 5 hour Oral Glucose Tolerance Test using 100 g of glucose. The study found that 53% had normal glucose tolerance; that is, they had normal fasting blood sugar and did not have impaired glucose tolerance (IGT) 2 hours after the glucose load. Of these people with normal glucose tolerance, 75% had abnormal blood sugar results between 30 minutes and 1 hour.
Normal Blood Glucose Pattern
Based on the above study, a little less than 1000 people (990) out of the total with normal glucose tolerance (4030) had a normal glucose pattern after having 100 g of glucose (see graph below). See how the blood sugar rises to a moderate peak and then decreases steadily until it’s back to where it started from at 2 hours. This is what blood sugar is supposed to do.
Abnormal Glucose Patterns
Almost the same number of people (961) as had normal glucose curves showed early signs of carbohydrate intolerance which can be seen most noticeably between 30 and 60 minutes. These folks had normal fasting blood glucose and but after 2 hours, blood glucose did not return to baseline, but did not meet the criteria for impaired glucose tolerance. Unless someone was looking between 30 and 60 minutes, one would not know it was not normal in between. Keep in mind, this graph represents the average blood sugar response of these individuals. Rather than blood glucose going up to a moderate peak and then falling gradually, a two-stage rise in glucose can be clearly seen between 30 minutes and 60 minutes before beginning to drop. These people had normal fasting blood sugar and while their blood sugar at 2 hours was below the cutoff for impaired glucose tolerance, it was higher than at baseline.
A little more than 1200 people (1208) had the follow abnormal glucose response between 30 and 60 minutes where blood sugar actually went slightly higher at 60 minutes than at 30 minutes before beginning to fall. While these people had normal fasting blood glucose their blood glucose did not fall to baseline at 2 hours but was below the cutoffs for impaired glucose tolerance.
Slightly more than 800 people (807) had an abnormal glucose response curve shaped as follows, with normal fasting blood glucose and 2-hour postprandial blood glucose results that were higher than at baseline, but did not meet the criteria for impaired glucose tolerance. What was significant is that blood sugar was significantly higher at 60 minutes than at 30 minutes.
The Significance of These Curves
The results of this study shows that even if fasting blood glucose is totally normal AND 2 hour postprandial blood glucose does not meet the criteria for impaired glucose tolerance, it often does not return to baseline and the blood sugar response between fasting and 2 hours is very abnormal. What can’t be seen from these graphs is what happens to the hormone insulin at the same time. This will be covered in a future article, but suffice to say that in the normal glucose response pattern, blood sugar response mirrors what is happening with insulin but in the abnormal blood glucose response insulin secretion is both much higher and lasts much longer. This is called hyperinsulinemia (high blood insulin) and contributes to many of the same health risks as Type 2 Diabetes, including cardiovascular risks (heart attack and stroke), abnormal cholesterol levels and hypertension (high blood pressure). This is like having “silent Diabetes”.
A “Waste of Healthcare Dollars”
When a person’s clinical symptoms and risk factors warrant it, I’ll request a 2 hour Oral Glucose Tolerance Test with an extra assessor at 30 minutes (and sometimes at 60 minutes) to determine how their glucose response compares to the above curves. Since these people have normal fasting blood glucose test results, a request for an Oral Glucose Tolerance Test (with or without the extra glucose assessor) is often declined as a “waste of healthcare dollars”.
What About Glycated Hemoglobin (HbA1C)?
A glycated hemoglobin test (HbA1C) measures a form of hemoglobin that binds glucose (the sugar in the blood) and is used to identify the person’s three-month average glucose concentration because blood cells turnover (get replaced) on average every 3 months.
While having a glycated hemoglobin test and a fasting blood glucose test is better than only having fasting blood glucose, it will still miss a significant percentage of people who are able to control their sugars between meals and overnight but who have significant spikes after eating food, between 30 minutes and 60 minutes, but that return to normal by 2 hours. Since most physicians will not even requisition a HbA1C test if a person’s fasting blood glucose is normal, and even if they do that test can miss the glucose spoke that occurs between 30 minutes and 60 minutes after eating, this is the reason I sometimes resort to using a Glucose Response Simulation.
Glucose Response Simulation
A simple, if somewhat crude means of assessing glucose response under a load can be done at home using an ordinary glucometer (a meter for measuring blood sugar) such as would be used by people with Diabetes, and either a 100 g of dextrose (glucose) tablets (available at most pharmacies) or the equivalent. As part of the services I provide to my clients, I work with those that want to do this type of estimate so that they can understand whether they fall into the 75% of people that have normal fasting blood sugar and do not have impaired glucose tolerance at 2 hour postprandial, but do have an abnormal glucose response, as well as hyperinsulinemia. I explain how to prepare for the test, step by step instruction for conducting the test and then I graph and analyze the data then teach them what the results mean.
Basis for Individualizing Carbohydrate Intake
These results are very helpful as firstly they help people understand the reason for reducing their carbohydrate intake over an extended period of time, in order to restore insulin sensitivity and insulin secretion. These results also enable me in time to individualize their carbohydrate intake once they have reversed some of their metabolic response, based on their own blood sugar response to a specific carbohydrate load. In time, some of these individuals may want to add some carbohydrate back into their diet in small quantities, so with this information, I can guide them to test a standard size serving of rice, pasta or potato compared to their own blood glucose response to 100 g of glucose.
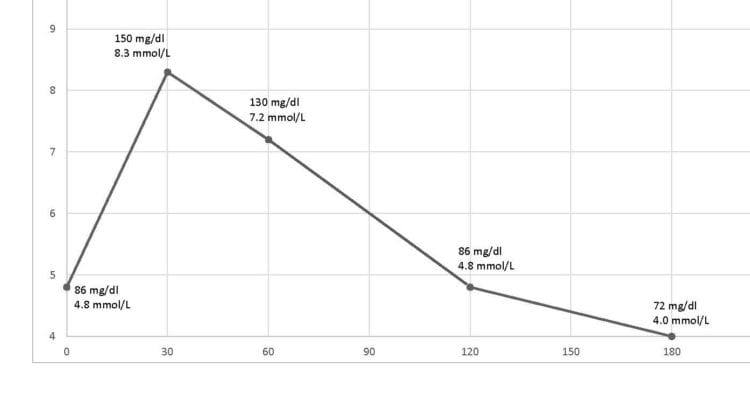
Below are three curves that I’ve plotted from people that all used the same type of glucometer (Contour Next One) which was rated as the best in a 2017 survey (see earlier post) and a standard 100 g glucose load as dextrose tablets or equivalent to 100 g of glucose [2]. I provided each one with identical instructions on how to run this simulation and to collect the results and ensured they understood.
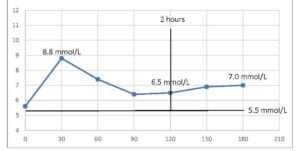
Example 1: The person below had a single glucose peak (similar to the early carbohydrate intolerance of the first abnormal curve, above) but blood glucose did not come back down to the fasting level even after 3 hours.
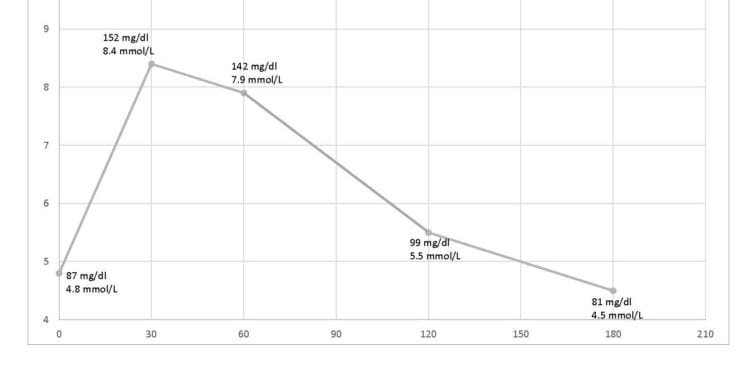
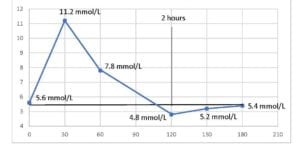
Example 2: The person below had a single glucose peak that reached abnormally high levels and that didn’t fall continuously downward but slowed, then dipped below baseline at 2 hours and that gradually came back to baseline over the following couple of hours.
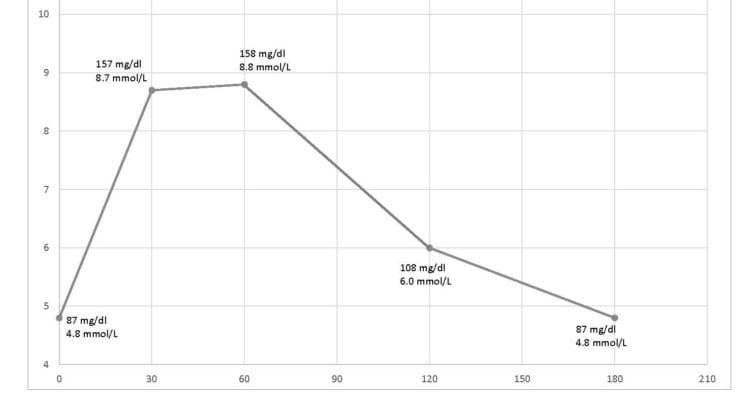
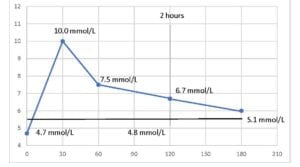
Example 3: This person had a similar initial rise as the person above, but no dip below baseline. In fact, this person’s glucose didn’t fall to baseline until almost 5 hours.
Some Final Thoughts…
An abnormal fasting blood glucose test may warrant further testing, however a normal result is frequently dismissed as being a sign that “everything’s fine”. Data from this study indicates that as many as 75% of people with normal fasting blood sugar may have abnormal glucose responses and associated hyperinsulimia and some of the same risks as someone who has already been diagnosed with Type 2 Diabetes, but they simply don’t know it.
With reliable and relatively inexpensive glucometers, as well as continuous glucose monitors (CGM) people don’t need to wonder whether they are in the minority with a normal glucose response.
Not knowing one is at risk does nothing to provide motivation to make dietary and lifestyle changes, but knowing one has an abnormal response to carbohydrate not only enables them to want to make changes, it enables them to find out in time which carbohydrates might be able to be added back into their diet, and in what quantities.
More Info
If you would like more information, you can learn about me here.
To your good health!
Joy
You can follow me on:
Twitter: https://twitter.com/jyerdile
Facebook: https://www.facebook.com/BetterByDesignNutrition/
References
- Crofts, C., et al., Identifying hyperinsulinaemia in the absence of impaired glucose tolerance: An examination of the Kraft database. Diabetes Res Clin Pract, 2016. 118: p. 50-7.
- Lamar, ME et al, Jelly beans as an alternative to a fifty-gram glucose beverage for gestational diabetes screening, Am J Obstet Gynacol, 1999 Nov 18 (5 Pt 1): 1154-7
Copyright ©2018 BetterByDesign Nutrition Ltd.
LEGAL NOTICE: The contents of this blog, including text, images and cited statistics as well as all other material contained here (the ”content”) are for information purposes only. The content is not intended to be a substitute for professional advice, medical diagnosis and/or treatment and is not suitable for self-administration without the knowledge of your physician and regular monitoring by your physician. Do not disregard medical advice and always consult your physician with any questions you may have regarding a medical condition or before implementing anything you have read or heard in our content.

I am a Registered Dietitian Nutritionist and the owner of BetterByDesign Nutrition Ltd. With a postgraduate degree in Human Nutrition and a background as a published mental health nutrition researcher, I have been dedicated to supporting my clients’ clinical needs since 2008.
I hold active professional licenses in BC (CHPBC), Alberta (CDA), and Ontario (CDO), allowing me to provide regulated Medical Nutrition Therapy across these provinces. My expertise spans chronic disease management, complex digestive health, and therapeutic diets. I am deeply passionate about helping people reclaim their health, rooted in my firm belief that Nutrition is BetterByDesign©.