Note: This article was originally posted on March 12, 2018 and was updated on November 25, 2025.
Introduction
Today I was reminded about a post that I wrote almost eight years ago (March 12, 2018), about an article that had been published in the Journal of the American Medical Association in September 2016 [1]. The article revealed that the sugar industry had funded three renowned Harvard researchers to write a series of articles that downplayed or ignored known research that demonstrated sugar was a contributor to heart disease and instead put the blame solely on fat — especially saturated fat. I was shocked by its significance, and it made me wonder how much of what I learned in my training needed to be revisited in this light.
The three Harvard researchers were the late Dr. Fredrick Stare, Chair of Harvard’s School of Public Health Nutrition Department, the late Dr. Robert McGandy, Assistant Professor of Nutrition at the Harvard School of Public Health, and the late Dr. D. Mark Hegsted, a Professor in the same department.
Dr. Hegsted went on to be directly involved in the development of the 1977 US Dietary Goals, which served as the basis for the 1980 Dietary Guidelines for Americans. These were the first Guidelines that called for Americans to decrease consumption of meat and saturated fat with the belief that it would lower the risk of heart disease.
Following suit, in 1977, Canada’s Food Guide went through a major revision with a shift to increased carbohydrates in the diet and decreased fat. Following a report submitted to Health Canada in 1977 by the Committee on Diet and Cardiovascular Disease, which advised the government to take action to prevent diet-related chronic diseases such as heart disease and high blood pressure, the revised 1982 Canada’s Food Guide shifted towards even lower-fat products.
I wondered today how many people know that decades of “low fat” messaging in both the US and Canada began by the sugar industry paying three prominent Harvard researchers to blame fat as the cause of heart disease, while discounting the role of sugar. I decided it was time to write another article.
Sugar Industry Funding Helped Shift Blame to Fat — Especially Saturated Fat
In the mid-1960s, the Sugar Research Foundation (SRF), predecessor to the Sugar Association, aimed to counter research which suggested that sugar, not fat, might be a bigger contributor to atherosclerosis. The committee invited Dr. Frederick Stare of Harvard’s School of Public Health Nutrition Department to join its scientific advisory board and approved $6,500 ($65,750–$66,850 in 2025 dollars) “to support a review article that would respond to the research showing the danger of sucrose [1]”.
From the 2016 Kearns et al. article [1]:
“On July 13, 1965, the Sugar Research Foundation (SRF)’s executive committee approved Project 226, a literature review on Carbohydrates and Cholesterol Metabolism by Hegsted and Robert McGandy, overseen by Stare.”
Letters were exchanged between the Sugar Research Foundation tasked the three Harvard researchers with preparing “a review article of the several papers which find some special metabolic peril in sucrose [sugar] and, in particular, fructose” [1].
In a letter written to Dr. D.M. Hegsted, the Sugar Research Foundation made its agenda clear:
“Our particular interest had to do with that part of nutrition in which there are claims that carbohydrates in the form of sucrose make an inordinate contribution to the metabolic condition, hitherto ascribed to aberrations called fat metabolism. I will be disappointed if this aspect is drowned out in a cascade of review and general interpretation.” [2]
Hegsted replied on behalf of the Harvard team, saying:
“We are well aware of your particular interest in carbohydrate and will cover this as well as we can” [1].
Project 226, sponsored by the Sugar Research Foundation, resulted in a two-part review by McGandy, Hegsted and Stare that was published in the New England Journal of Medicine in 1967 titled “Dietary Fats, Carbohydrates and Atherosclerotic Disease” [3]. There was no mention of the Sugar Research Federation sponsorship of the research [1].
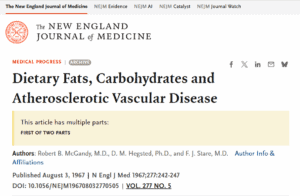
Dietary Fats, Carbohydrates and Atherosclerotic Disease
The first part of the two-part review article written by Drs. Stare, Hegsted and McGandy stated;
“Since diets low in fat and high in sugar are rarely taken, we conclude that the practical significance of differences in dietary carbohydrate is minimal in comparison to those related to dietary fat and cholesterol.”
The report continued:
”the major evidence today suggests only one avenue by which diet may affect the development and progression of atherosclerosis. This is by influencing the levels of serum lipids [fats], especially serum cholesterol.“
”…there can be no doubt that levels of serum cholesterol can be substantially modified by manipulation of the fat and cholesterol of the diet.“
”on the basis of epidemiological, experimental and clinical evidence, that a lowering of the proportion of dietary saturated fatty acids, increasing the proportion of polyunsaturated acids and reducing the level of dietary cholesterol are the dietary changes most likely to be of benefit.“
Dr. Marion Nestle, Professor of Nutrition, Food Studies and Public Health at New York University, wrote an editorial that appeared in the same issue of the Journal of the American Medical Association as Kearns’ article [1]. In it, she said that the documents provided “compelling evidence” that the sugar industry initiated Project 226 to exonerate sugar as a major risk factor for coronary heart disease [4].
Hegsted and the 1977 US Dietary Goals
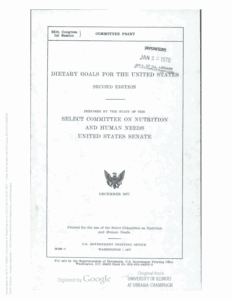
Dr. Hegsted went on to play a significant role in advising the Select Committee on Nutrition and Human Needs that oversaw the development of the 1977 Dietary Goals for the United States — and oversaw the writing of the first Dietary Guidelines for Americans that called for a reduction in saturated fat consumption to lower the risk of coronary heart disease [5], [6].
Below is a quote about Dr. Hegsted’s role in the Select Committee on Nutrition and Human Needs that oversaw the 1977 Dietary Goals for the United States.
“Dr. Hegsted has worked very closely and patiently with the committee staff on this report, devoting many hours to review and counselling. He feels very strongly about the need for public education in nutrition and the need to alert the public to the consequences of our dietary trends. He will discuss these trends and their connection with our most killing diseases. [5]”
There were 8 hearings of the Committee titled “Diet Related to Killer Diseases” that were held from July 1976 until October 1977 [6], which provided an opportunity for US senators to hear from leading scientists, government officials, and business representatives about the risks of diet on heart disease, cancer, and other chronic diseases.
“Of those who gave testimony at the first hearings, perhaps the two most important were assistant secretary for health and former director of the National Heart and Lung Institute, Theodore Cooper, and Professor Hegsted” [6].
Interestingly, Dr. Hegsted admitted that the primary evidence for “killer diseases” was epidemiologic, the weakest form of scientific data, and not clinical data [8]. Despite this admission, Hegsted stated that there was ”a clear linkage between plasma serum lipids, atherosclerosis and coronary disease” and that it was ”clear that diet controls cholesterol levels“ [8].
Hegsted’s statement that there was “a clear linkage” between plasma fat and heart disease was based on only 8 randomized clinical trials that were available at the time, and which had only 2,467 male subjects, and no female subjects [9].
Furthermore, there was no clinical evidence that reducing total fat or saturated fat lowered death from all causes or cardiovascular disease [9].
Several researchers pleaded with the Committee to wait for more research. The director of the National Heart, Lung and Blood Institute, Dr. Robert Levy, said “no one knew if eating less fat would prevent heart attacks“.
Dr. Robert Olson of St. Louis University said, “I plead in my report and will plead again orally here for more research on the problem before we make announcements to the American public.”
Dr. Peter Ahrens said, “advising Americans to eat less fat on the strength of such marginal evidence was equivalent to conducting a nutritional experiment with the American public as subjects“.
Committee Chairman Senator McGovern responded:
“Senators don’t have the luxury that the research scientist does of waiting until every last shred of evidence is in.”
Hegsted believed there could be “no risk” to recommending that the American public eat less meat, less fat, particularly saturated fat, and less cholesterol [8].
Long-Term Outcomes and Modern Evidence
Hegsted relied heavily on Ancel Keys’ yet-unpublished Seven Countries Study [9], which compared men aged 40–59 in the USA, Finland, the Netherlands, Yugoslavia, Greece, and Japan.
The Seven Country Study data have been criticized for decades for several reasons, including the fact that Keys omitted countries such as Switzerland or France, which were known to have very high saturated fat consumption, yet low rates of heart disease.
In addition, data from Greece, Italy and Yugoslavia were thought to have not been representative of what they normally ate, since these countries were still facing poverty post WWII.
Despite the limitations, a hypothesis linking saturated fat to heart disease formed the basis for 40+ years of low-fat dietary advice in the US and Canada. These recommendations were largely epidemiology-based and assumed that reducing meat and saturated fat while increasing grains and cereals carried no risk.
The results?
Heart disease remains the leading killer — not only in the US, but according to the CDC, worldwide. Decreasing dietary saturated fat did nothing to change this. In fact, a 2020 meta-analysis in the Journal of the American College of Cardiology found no benefit in lowering saturated fat for cardiovascular disease or mortality, and suggested saturated fat may be protective against stroke [7].
Meanwhile, over the past 40+ years, obesity and type 2 diabetes rates have skyrocketed, along with carbohydrate intake — both of which are known to increase the risk of cardiovascular disease.
Final Thoughts
It is historically significant that the sugar industry’s funding of three Harvard researchers resulted in the absolving of sugar as having a role in the development of heart disease and placed the blame solely on saturated fat.
Dr. Hegsted’s subsequent influence on the 1977 US Dietary Goals and the 1980 Dietary Guidelines highlights the adverse role that industry-sponsored research can have on people’s health.
National dietary guidelines concerning saturated fat intake based on weak epidemiologic data “was equivalent to conducting a nutritional experiment with the American public as subjects.”
As a Dietitian, making recommendations to individuals to lower dietary saturated fat intake based on lab work and family history is good clinical practice. Establishing general population-based dietary guidelines to reduce the intake of saturated fat based on weak evidence is not.
National dietary guidance must be based on robust clinical data, as well as epidemiological studies — including the impact of different types of fats in heart disease. It also needs to factor in the role of sugar and refined dietary carbohydrates as drivers of obesity and metabolic disease, which can contribute to heart disease.
More Info
If you have been eating “low-fat everything,” yet finding your blood sugar steadily rising, I can help. Learn about me and the Comprehensive Dietary Package here.
To your good health.
Joy
You can follow me on:
Twitter: https://twitter.com/jyerdile
Facebook: https://www.facebook.com/BetterByDesignNutrition/
References
- Kearns C, Schmidt LA, Glantz SA, et al. Sugar Industry and Coronary Heart Disease Research: A Historical Analysis of Internal Industry Documents. JAMA Intern Med. 2016;176(11):1680-1685. [https://pubmed.ncbi.nlm.nih.gov/27617709/]
- Husten L. How Sweet: Sugar Industry Made Fat the Villain. Cardio|Brief, Sept 13, 2016. [https://www.cardiobrief.org/2016/09/13/how-sweet-sugar-industry-made-fat-the-villain/]
- McGandy RB, Hegsted DM, Stare FJ. Dietary fats, carbohydrates and atherosclerotic vascular disease. N Engl J Med. 1967;277(5): part 1: pg. 186-192 and part 2: pg. 242–247. [part 1: https://www.nejm.org/doi/10.1056/NEJM196708032770505], [part 2: https://www.nejm.org/doi/abs/10.1056/NEJM196707272770405]
- Nestle M. Food Industry Funding of Nutrition Research: The Relevance of History for Current Debates. JAMA Intern Med. 2016;176(11):1685–1686. [https://pubmed.ncbi.nlm.nih.gov/27618496/]
- Dietary Goals for the United States, Select Committee on Nutrition and Human Needs, United States Senate. Washington: U.S. Govt. Print. Off., 1977. [https://www.govinfo.gov/content/pkg/CPRT-95SPRT98364O/pdf/CPRT-95SPRT98364O.pdf]
- Oppenheimer GM, Benrubi ID. McGovern’s Senate Select Committee on Nutrition and Human Needs versus the meat industry on the diet-heart question (1976-1977). Am J Public Health. 2014;104(1):59–69. [https://pmc.ncbi.nlm.nih.gov/articles/PMC3910043/]
- Astrup A, Magkos F, Bier DM, et al. Saturated Fats and Health: A Reassessment and Proposal for Food-based Recommendations. J Am Coll Cardiol. 2020;75(24):3118–3135. [https://pubmed.ncbi.nlm.nih.gov/32562735/]
- United States Congress. Diet related to killer diseases: hearings before the Select Committee on Nutrition and Human Needs. 1977. [Link]
- Harcombe Z. An examination of the randomized controlled trial and epidemiological evidence for the introduction of dietary fat recommendations in 1977 and 1983. 2015. [https://pubmed.ncbi.nlm.nih.gov/25685363/]
- Yerushalmy J, Hilleboe HE. Fat in the diet and mortality from heart disease: a methodologic note. N Y State J Med. 1957. [https://pubmed.ncbi.nlm.nih.gov/13441073/]

Please note: At this time, all services are provided via a secure telehealth portal.
© 2025 BetterByDesign Nutrition Ltd. All rights reserved.

Joy is a Registered Dietitian Nutritionist and owner of BetterByDesign Nutrition Ltd. She has a postgraduate degree in Human Nutrition, is a published mental health nutrition researcher, and has been supporting clients’ needs since 2008. Joy is licensed in BC, Alberta, and Ontario, and her areas of expertise range from routine health, chronic disease management, and digestive health to therapeutic diets. Joy is passionate about helping people feel better and believes that Nutrition is BetterByDesign©.